Using both Google Analytics 4 and Universal Analytics for reporting supremacy

When it rolled out in late 2020, Google Analytics 4 saw huge excitement among the digital marketing community, with many keen eyes eager to explore what it had to offer. Indeed, GA4 was announced as the successor to Universal Analytics as we know it, with the new version tipped to quickly usurp the status quo on how to use Google Analytics on a day to day basis.
 Many digital marketing thought leaders, analytics experts and SEO influencers encouraged early adoption and encouraged us to clue ourselves up quickly on the platform to get ahead of the curve and on-board with the direction GA was taking. As a brand-new product separate to UA within the GA suite, heeding such advice was wise, especially with what appears to be a steep learning curve.
Almost a year into the life of GA4, and with the product still very much in beta, many marketers and early adopters of GA4 still revert back to good old UA in order to get the reporting data they need in their familiar and convenient ways. GA4’s interface may also prove confusing to some even if some of the new data sections provide never-seen-before insights with exciting integration potential. In addition, with a limited API on offer, many marketers may also find further frustration in the lack of ability to integrate GA4 into their usual third party tooling suites.
Clearly, GA4 is still a work in progress.
Yet GA4 is clearly the future of Google Analytics, so we better get used to it. New features will inevitably be given to GA4 exclusively from now on. Universal Analytics may even be slowly phased out at some point. For now however, as marketers we are in the unique position of possessing the powers of both platforms that offer different reporting capabilities and data. So why not used both to our advantage while we can? Let’s explore what we can do to harness the advantages of both and how they complement each other.
Different measuring types
This the crux of the key differences in how data is presented between the two platforms. GA4 offers an event-driven model as opposed to a sessions/page views model which effectively simplifies how we interpret pageviews by focusing more on events across your site. This is exciting as it will eventually mean the end of manually configured events. This is made easier with the help of Google Tag Manager integration within GA4 as well. Events as a measuring type also provide more insight and context of user behaviour.
This event-driven model is grouped into four categories:
Automatically collected events (page views, visits, sessions)
Enhanced measurement events (scrolls, site searched, outbound clicks)
Recommended events (transactions, sign-ups, form completion depending on your site industry type)
Custom events (parameters you can create based on your own requirements)
In addition, GA4 offers a more flexible cross-device and cross-platform/domain reporting offering than Universal Analytics. This means that within one property, you’ll be able to crunch reporting across different domains, sources and campaigns with relative ease. Universal Analytics currently sees heavy reliance on the setting up of different views in order to flick between domains and campaigns to measure performance, although we’ll delve into the pros of that over GA4 shortly.
So how do I find what I was looking for before?
The new take on reporting type doesn’t come without its own initial headaches, however. Inevitably, the presentation of a brand new reporting interface and measuring type means that we will have to slowly rewire our brains in how to go about finding what we are used to. One reporting use that we find ourselves commonly reverting back to UA for that doesn’t appear to be navigable from the offset within GA4’s interface is the reporting data on individual URLs.
For example, if we want to see a breakdown of traffic and goals attributed to URLs by a certain channel, something which often forms part of ad-hoc reporting requests, we simply follow "Acquisition Overview", click on our channel of choice and there we are:

A similar view on URL by URL data can be found by heading to "Behaviour-Behaviour Flow-Site Content-All Pages". Within GA4 not only is the familiar Behaviour section gone, but the former overview in acquisition looks something like this:

Now there’s nothing wrong with what’s being presented here, however naturally I want to be able to click through on “Organic” for example, and be presented with a list of URLs and their corresponding metrics for some quick analysis. This may work out easier and more tangible in the long run, though doing away with some familiar quick data points if we’re faced with certain ad-hoc requests does mean Universal Analytics may still get heavy use.
Analysis Hub
This is one where GA4 has the edge over its predecessor and is an exciting addition to our reporting toolsets. The Analysis Hub offers the ability to view and create visualisations of our reports using a series of templates and customisable options, some of which were previously only available to paid GA 360 accounts. What’s more, the Analysis Hub also integrates automation through machine learning which will unlock a great deal of reporting and time-saving potential.

One report to delve straight into (particularly if you’re an ecommerce brand) is the “Funnel Analysis” template which allows you see how users navigate through your website using certain paths and events. This effectively saves a great deal of time for analytics specialists hunkering down with funnel analysis and creating funnel segments in UA.
For many of these reporting templates within the Analysis Hub, all you have to do is configure your required traffic segments, dimensions and metrics and then select your data visualisation style. Filter accordingly and save these views so you have different reports for different segments and journeys.
One view to rule them all
GA4, as it stands, only offers one view. This makes sense, given that it’s a lot easier to filter by certain dimensions within the main GA4 interface if you wish to assess performance per channel, country, or individual domains if you’re embarking on a cross-domain analytics campaign for example.
This of course has its advantages, as eventually, it will mean a cleaner one size fits all option for GA in general for us to filter and crunch data accordingly. Many of us however will have spent time familiarising with and building out tailor-made views to access data across a variety of reporting scenarios with ease. Many third-party SEO platforms (and indeed Google Data Studio) allow for the easy integration of these views into their reporting frameworks. In addition, for the SEO professional or team who may have their dedicated Organic view within the master business analytics property, having a nuanced and carefully configured GA view is a complete must-have.
While GA4 will eventually replace traditional views as we know it with easier customisability within one hub, harnessing all the existent power within UA to create views according to your reporting needs is still powerful for the time being.
Attribution modelling
Currently, GA4 only offers limited attribution capabilities in the form of first click and last click measurement. This leaves out a host of options currently available in Universal Analytics such as a time decay, position-based and linear attribution.
If you’re working across complicated multi-funnel channel marketing and advertising campaigns. ensuring a comprehensive attribution model that goes beyond first and last click is vital to measure and optimise performance. While this may veer slightly away from day to day use of GA from the perspective of the SEO, this does raise questions on the overall commercial readiness of GA4 for larger business and agencies that rely on it for their advertising campaigns.
There are a lot of resources online on attribution modelling within Universal Analytics and Google themselves cover it in detail on their analytics support. While this is a big deficit within the current armoury of GA4, this may change at some point in the future. For now though, Universal Analytics still rules the roost in overall commercial use for big businesses.
BigQuery integration
This is a huge plus for GA4. Traditionally, BigQuery integration was only available to users of the paid version of GA, that being GA 360. Now that it’s free with GA4 (although BigQuery comes with a cost) it allows us potential access to unsampled, limitless data and advanced analysis capabilities through BigQuery itself.
BigQuery is a huge data warehouse that solves common issues of storing and processing large datasets, quickly. We highly recommend you enable this within your GA4 properties as it will allow you to enrich your current reporting data with a complete log of events to be able to deeply analyse a multitude of metrics and easily scale up your reporting in general.
This will likely end up being the overall death knell of Universal Analytics in the long run, despite GA4’s currently lacking a few crucial areas as detailed above. Find out how you can profit from the use of BigQuery in GA4 with this detailed guide.
Data visualisation
This one may come down to personal subjective opinion, though given that both platforms offer separate methods of data collection and analysis capabilities, they offer slightly different ways in which they visualise data.
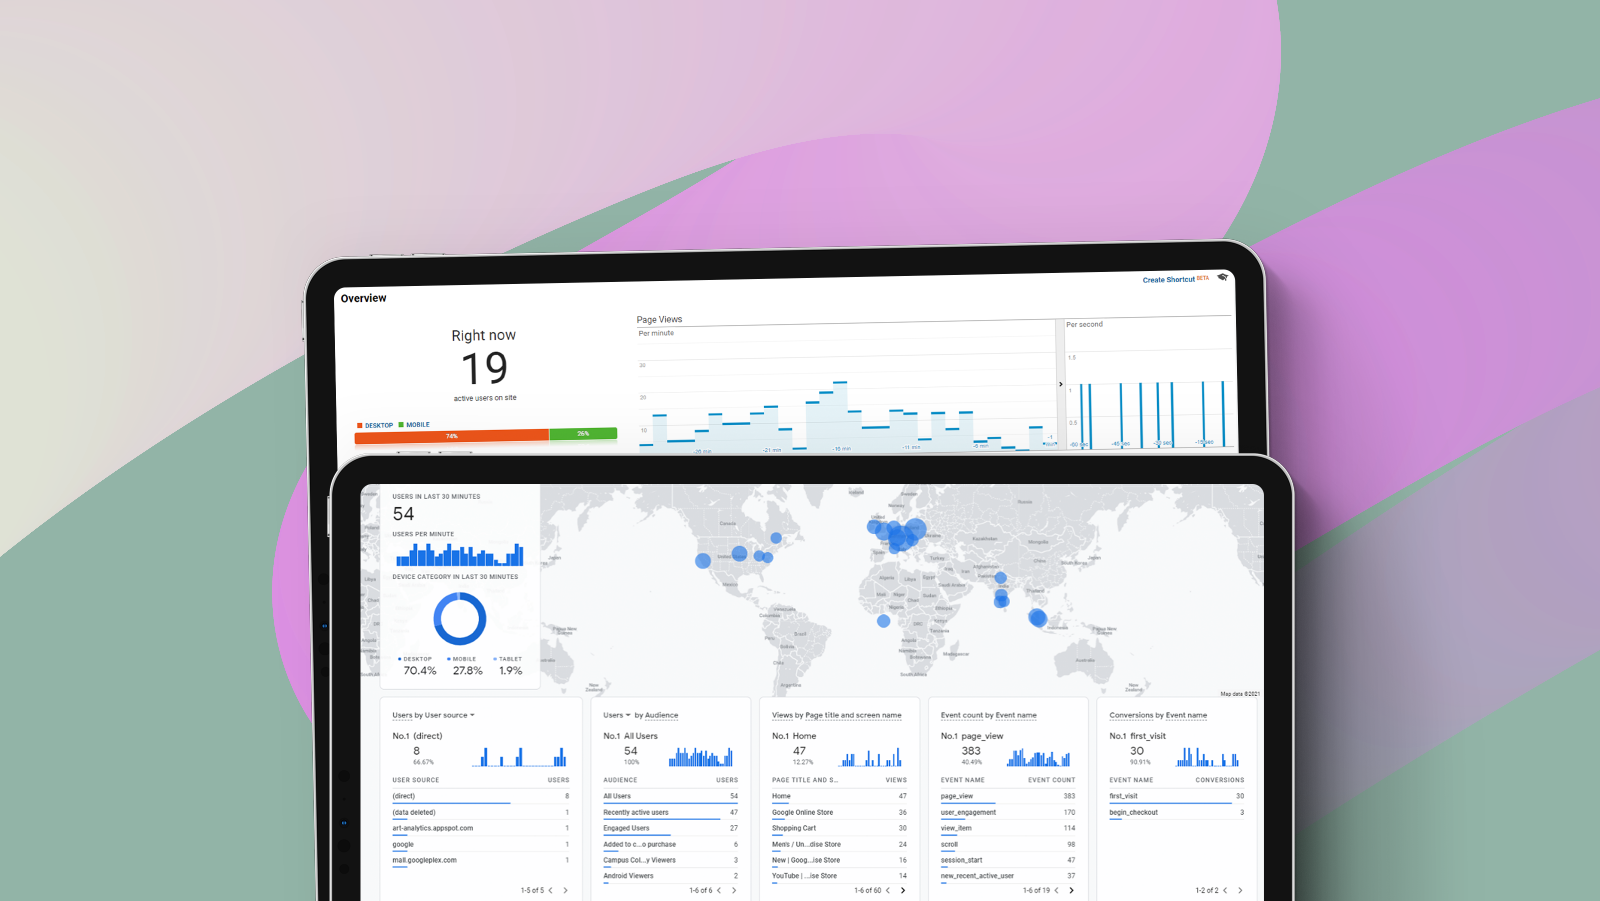
While the home page default data visualisations don’t differ too much in terms of what’s offered, if we head to the “Real Time” overview we can see the two are worlds apart.
Let’s take a look at the overview dashboard of Real Time data on Universal Analytics versus GA4:
Universal Analytics

Google Analytics 4

The differences are indeed vast. While we may be tempted to lean on the advantages of familiar old Universal Analytics here, it’s clear that GA4 is streets ahead in not only its presentation but also what data is on offer. You can even interact with these data points as well as comparisons by up to five dimensions which isn’t a thing in UA. Simply click on the “Real Time” overview within GA and we’ve got ourselves a report that wouldn’t look out of place on a properly hinged together reporting suite.
Across the platform in other areas too, GA4 appears to opt for a much more user-friendly visualisation of data compared to the somewhat statuesque line and bar graphs we see across the old version. The overview on the “Acquisition” tab in general appears a lot more easy on the eye and summarises some key data points:

In summary: it’s clear you should continue to use both
It’s clear that as work in progress beta version, GA4 still has a long way to go despite some clear advantages (in particular the BigQuery integration). GA4 also looks to be heading towards a nicer user interface with better and more useful visualisation among other things.
Yet there are some key points missing for sure and you may find yourself leaning back into UA for the foreseeable to report back your core KPIs the way you know-how. After all, Universal Analytics has been around for a while now and is very much the finished article in terms of product offering and how to fits into the existent reporting workflows of most marketers.
While Google will likely eventually flick the switch with Universal Analytics, with GA4 still being very much in beta we don’t see this happening for a long while yet. Be sure to stay tuned for updates.
Sign-up to Reddico News
To keep up-to-date with the latest developments in the world of SEO, our insights, industry case studies and company news, sign-up here.