Using Looker Studio for effective SEO reporting in the age of GA4

July 1st 2024 saw the digital marketing industry say a final goodbye to Universal Analytics with Google shutting down all accessibility to the platform and any historic data within it. The platform had in fact stopped processing data a year before this, with its successor Google Analytics 4 (GA4) being gradually phased in as its replacement in the years running up to this.
Despite it being around for a while, GA4 has seen a lot of criticism. However, there are workarounds to some of its perceived shortcomings, and one of these is Looker Studio (formerly Google Data Studio). Let’s take a look at how we can use Looker Studio to its full potential to circumvent any GA4 headaches.

Common gripes with GA4
We’ve covered a few topics on all things GA4 before, notably a piece back in the summer of July 2022 encouraging brands to transition to the platform as soon as possible in order to familiarise themselves with it and get up to speed ahead of the game. The piece detailed some configuration as well as some of the new features it offered, notably BigQuery integration. GA4 presents analytics data differently, opting to focus on events-based model metrics over session-based metrics primarily.
However, there has been no shortage of complaints surrounding the platform. Common gripes include a poor user interface, discrepancies in data, a steep learning curve (even for those well-versed in analytics suites), bugs, and even the ability to drill down on certain page level data that was such a core feature of its predecessor.
With GA4 being a relatively new product, we can expect things to improve. Google keeps its channels open for feedback, and there are frequent additions to the platform’s capabilities. However, for brands looking for ways to get around some of these pain points in their SEO reporting, Looker Studio can be a great ally.
How can Looker Studio help with granular GA4 reporting?
While one of the notable features of GA4 is its ability to customise dashboards and reporting graphs natively within the platform, the aforementioned UI shortcomings coupled with the greater flexibility offered by Looker Studio often presents a preferable alternative. Looker Studio can also (to a degree) replicate some of the traditional Universal Analytics views that aren’t as easily as accessible within GA4.
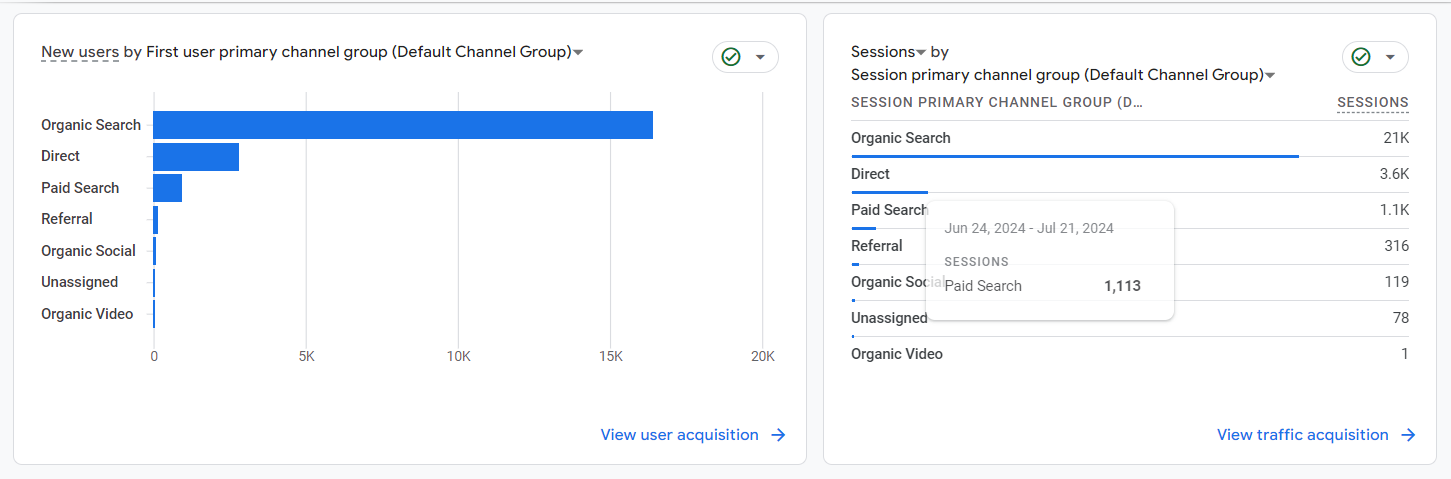
For example, if a brand wanted to jump into the default setup of their GA4 account and get a view on top level performance, they might head to the “Reports snapshot” section. This area of GA4 can be customised, though by default will show a graph depicting user visits over time, real time active users, users by channel group, location, event counts and insights such as which pages (by page titles) get the most views:
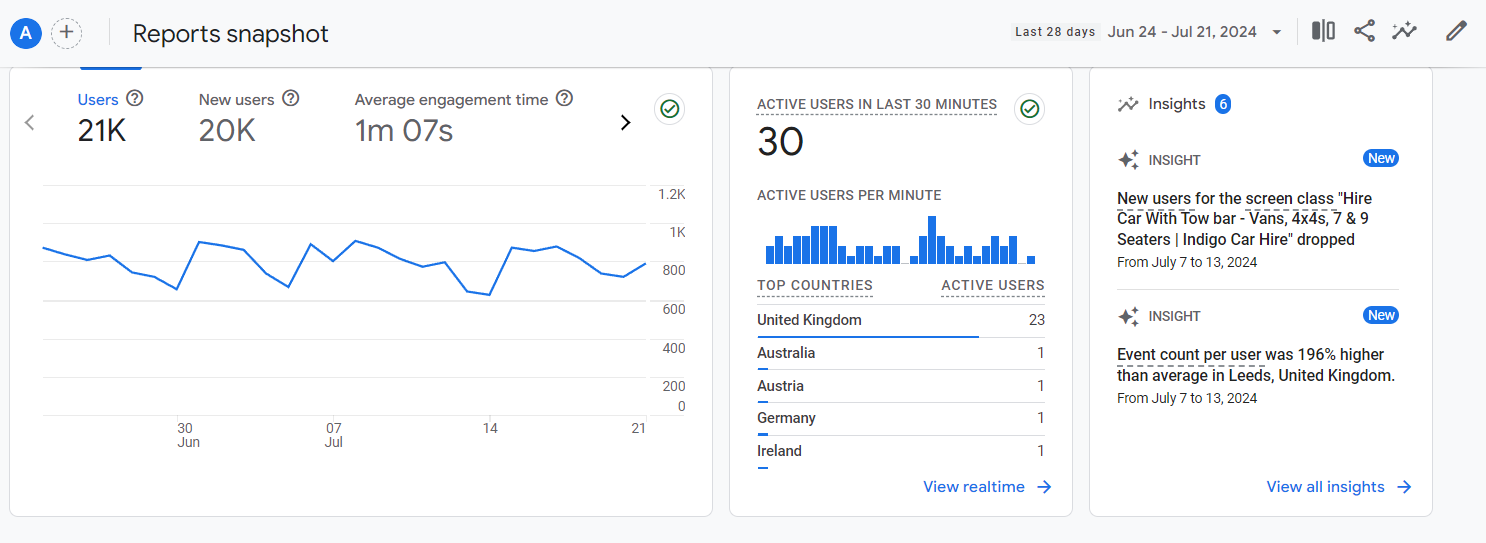
However, to get a more granular overview on data trends over time, Looker’s wide range of graphs and ability to blend in data views combining metrics such as sessions, page views and conversions in one place can be a great option.
As we mentioned, there are a number of templates out there which can help with a variety of reporting needs. Looker Studio even has a gallery of templates available which you can quickly copy and start to populate.
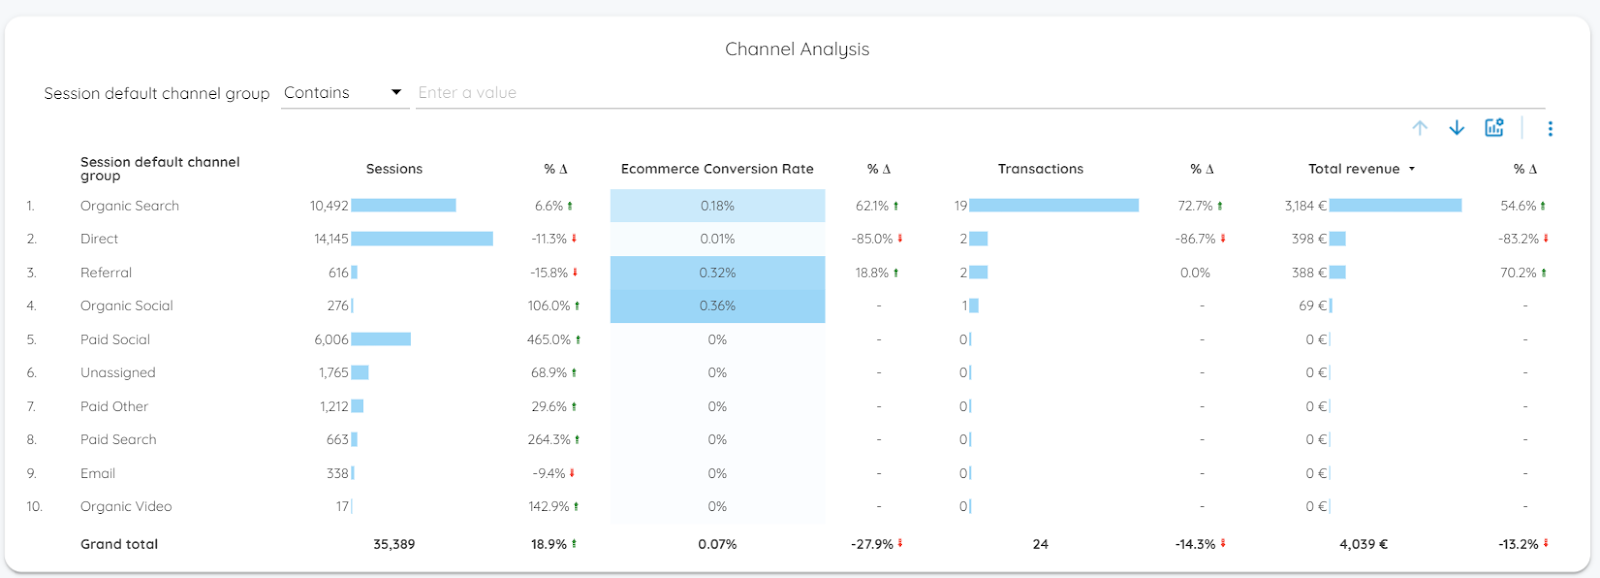
For ecommerce brands, for example, there are a number of templates available that may offer more valuable and granular detail from a transactional and revenue-based lens compared to what’s offered natively in GA4. Here’s a look at a popular ecommerce Looker Studio template which provides a snapshot of revenue over time, revenue by channel, products, device and country, as well as a drilldown of channel by channel performance:
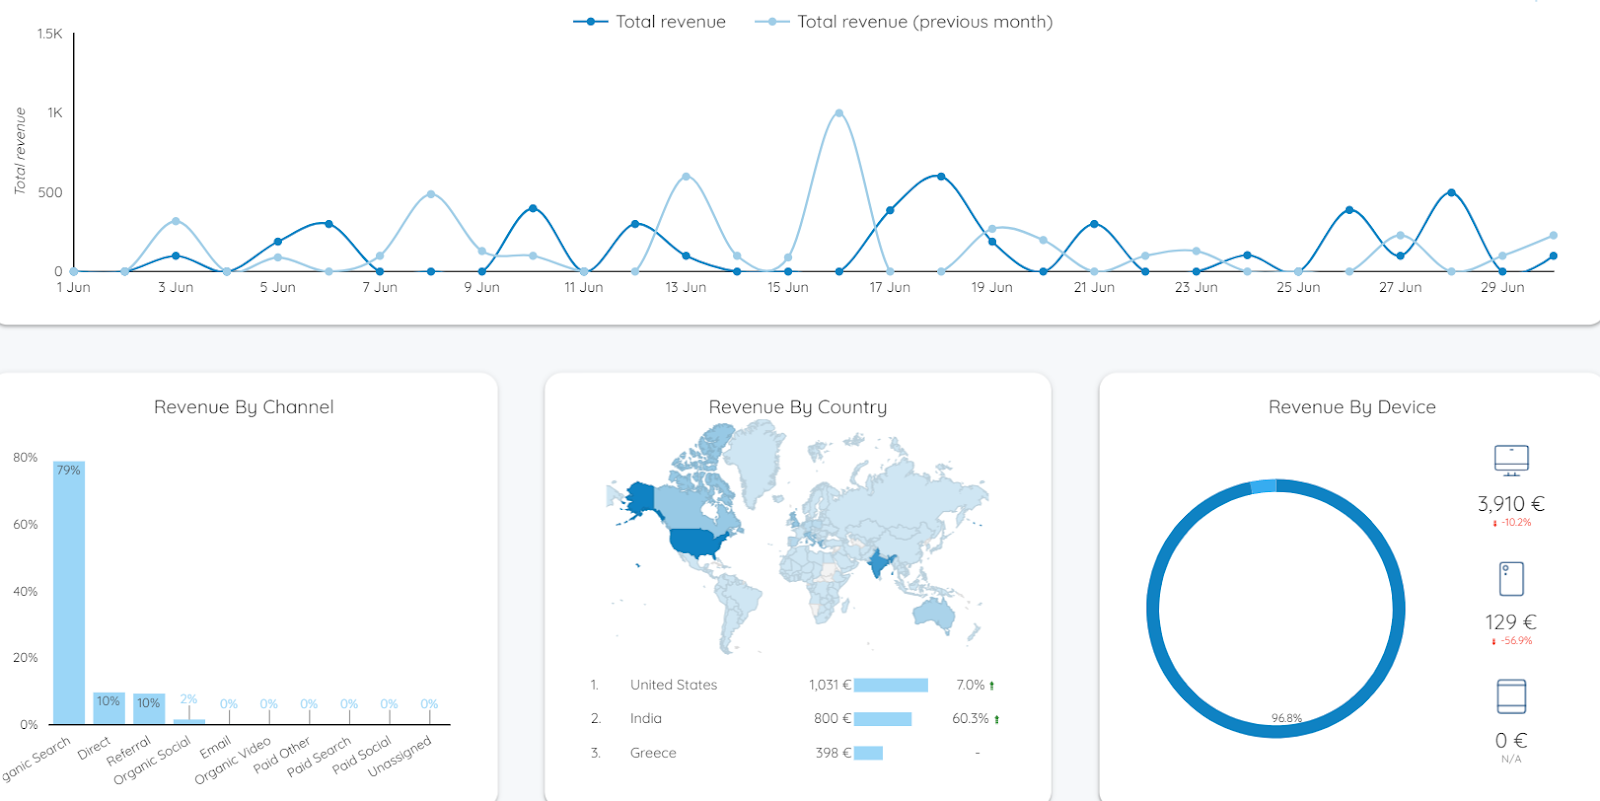
In short, using Looker Studio provides a great deal of flexibility to effectively concentrate all the metrics your business cares about in one place, in a way that is more difficult in GA4 owing to its UI, among other things. While GA4 can be modified and has features such as BigQuery connection to help visualise data better, Looker Studio allows the potential to do this with much greater ease.
A simple connection to a GA4 data source will allow you quickly spin up a table, graph or chart and pull in data on metrics and dimensions on the below (and more) to analyse:
Active users
Average purchase revenue
Campaign ID
Checkouts
Content type
Conversions
Device
Engaged sessions
Event revenue
New users
Page path
Session source
Total revenue
Transactions
Take a look at the full list of metrics available with a GA4 data connection here.
Looking at the above and taking into account a hypothetical reporting need for an ecommerce business, for example, Looker Studio will be able to answer most reporting requirements. If the brand in question wanted a visualisation of how many users from New York are visiting a particular product page, how long they are spending on the page in average, and what percentage of these users are bouncing off and not converting, this can be achieved quite easily with Looker Studio. This level of customisation and granularity can be very powerful in informing marketing decisions moving forward.
Getting more out of Looker Studio with Google Search Console
On top of the myriad of reporting visualisations possible with a GA4 integration, you can also get a great deal out of the platform by integrating Google Search Console too. Much like addressing some of the pain points from GA4, Looker Studio offers workarounds for bypassing some of the limitations of the native platform by bringing data from Search Console data into one place. For example, instead of hopping around the different segments of the Google Search Console platform to get insights on clicks, click through rates, queries users use to discover your site, and indexation reports separately, you can pull this together into one master dashboard.
Laying all of this alongside your GA4 data (for example, you can align conversions and sessions on a URL basis alongside keyword data from Google Search Console) can be a vital additional layer of analysis on your SEO campaigns.
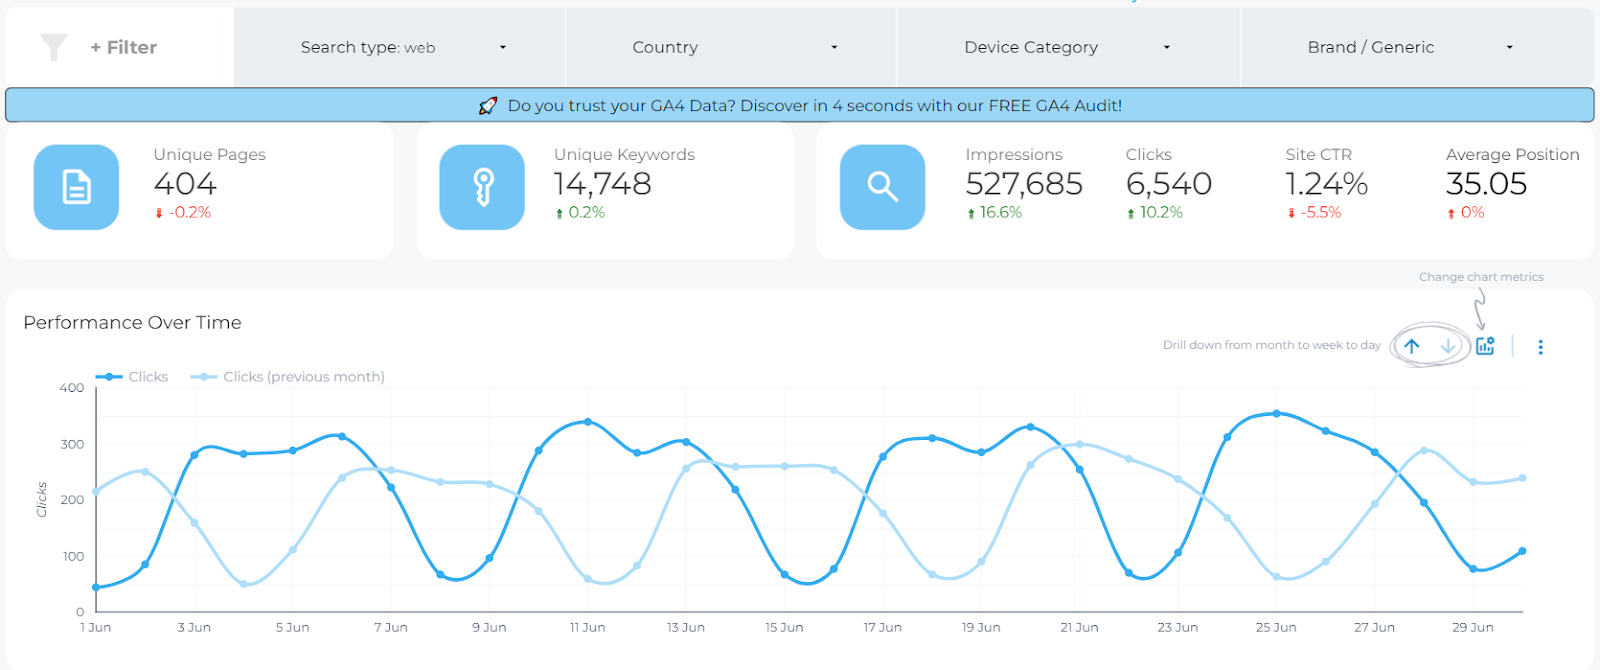
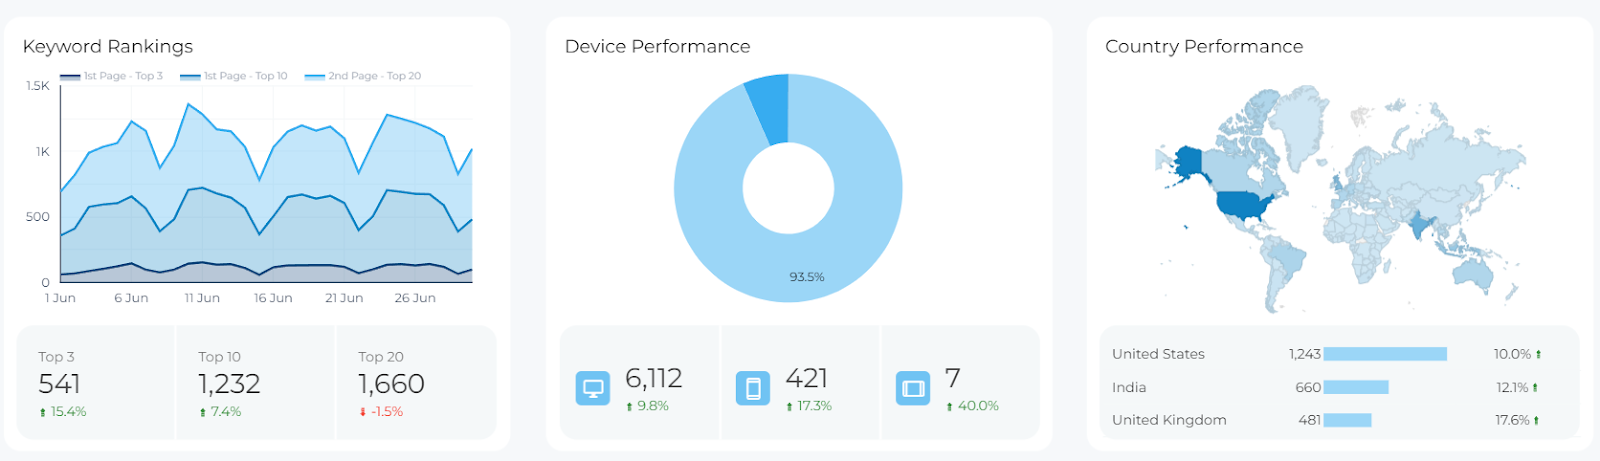
Again, there are plenty of templates available if you’re looking for inspiration or are looking for somewhere to get started. Another popular template within the Looker Studio gallery tweaks and consolidates all of the data available from Google Search Console to provide compelling overviews on performance over time, keyword rankings, country performance, detailed keyword analysis and more. Like GA4 integrations, all of this can be viewed across selected data periods.
You can also export Google Search Console to BigQuery and then plug this into Looker Studio to get even more data flowing on an ongoing basis. Couple this with the BigQuery connector from GA4 and Looker Studio can be an incredibly powerful asset that can get the best out of both Search Console and GA4 without having to navigate through these platforms natively.
Refining your Looker Studio dashboards
While Looker Studio is relatively easy to use in terms of setting up data connectors and getting some initial visualisations flowing, there is some advanced knowledge required in order to get more out of the platform. This can extend to creating custom metrics and conditional formatting, as well as the use of regular expressions (RegEx) to apply specific filters and focus points on the data you're seeing.
The platform can also be relatively easy to “break” if a certain connector, filter or metric is edited or tweaked with, so make sure your team building the reporting dashboards know what they’re doing before the reports are sent out across the business.
Ultimately, however, flexibility and freedom are your greatest friends when it comes to Looker Studio. You can quickly build out separate dashboards for different areas of your website or business and for different teams, taking it beyond SEO.
On a singular Looker Studio report, you could very readily build out pages that cover performance across different content types, products across your industry, geographical locations, different marketing channels and more.
What about the future of GA4?
As we mentioned, GA4 hasn’t received the warmest of welcoming parties since its induction, and many in the industry long for Universal Analytics, or at least some of its legacy features. This is unlikely to be the case moving forward, however, with Google very much sticking to its promises in terms of the deadlines in the run up to the switching off of Universal Analytics.
What we have seen in recent months is some improvements in features and functionality of GA4, with the landing page report being a welcome addition, particularly for those in the SEO industry.
Alongside this, the frequency of updates to the platform show that Google are taking its development seriously, and it isn’t going away anytime soon. Businesses are advised to keep a keen eye on updates to the platform as its functionalities evolve.
Frustrations over its limitations or UI aside, however, Looker Studio can help you unlock the power of GA4, as well as Google Search Console (and plenty of other third-party data providers) to visualise the metrics you care about in a way that is best suited to your business.
About the author
Michael Carden-Edwards is SEO Strategy Lead at Reddico. A seasoned SEO and digital marketing expert with 13+ years of experience, Michael has directed SEO strategies for major brands like British Airways and O2 as well as conducting countless public and internal SEO training sessions. Based in Sevilla, he joined Reddico in 2021, enjoying the flexible working and unique culture from a sunnier climate.
Sign-up to Reddico News
To keep up-to-date with the latest developments in the world of SEO, our insights, industry case studies and company news, sign-up here.